After logging in, the property manager will be presented with a dashboard of four widgets reflecting the last 30 days worth of elevator car calling statistics:
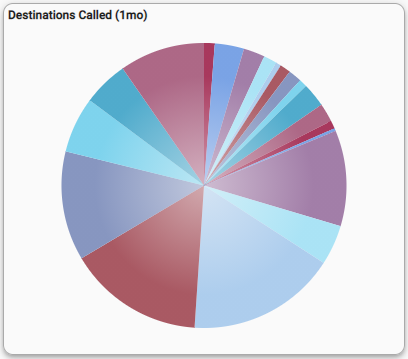
The Destinations Called widget shows graphically the percentages each accessible destination is called.
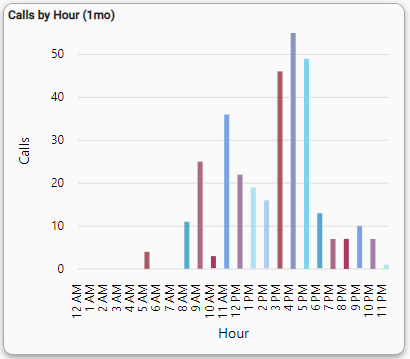
The Calls by Hour widget displays as a vertical bar chart the total times during the day when
the elevator has been called.
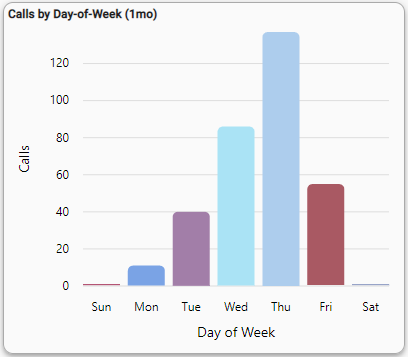
The Calls by Day-of-Week widget shows a vertical bar representation of the total number of
calls based upon the weekday.
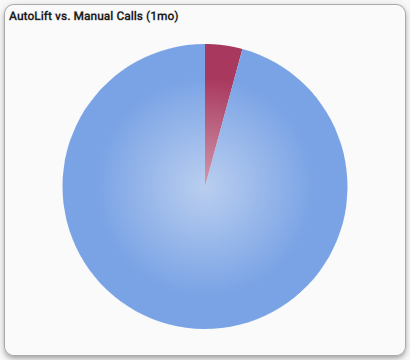
For buildings licensed for LiftOff Mobile™, the AutoLift vs. Manual Calls (1mo) pie chart shows the
percentage of calls placed automatically via LiftOff mobile’s Auto Lift feature vs. those calls
placed by a user explicitly selecting a destination floor.